
![]()
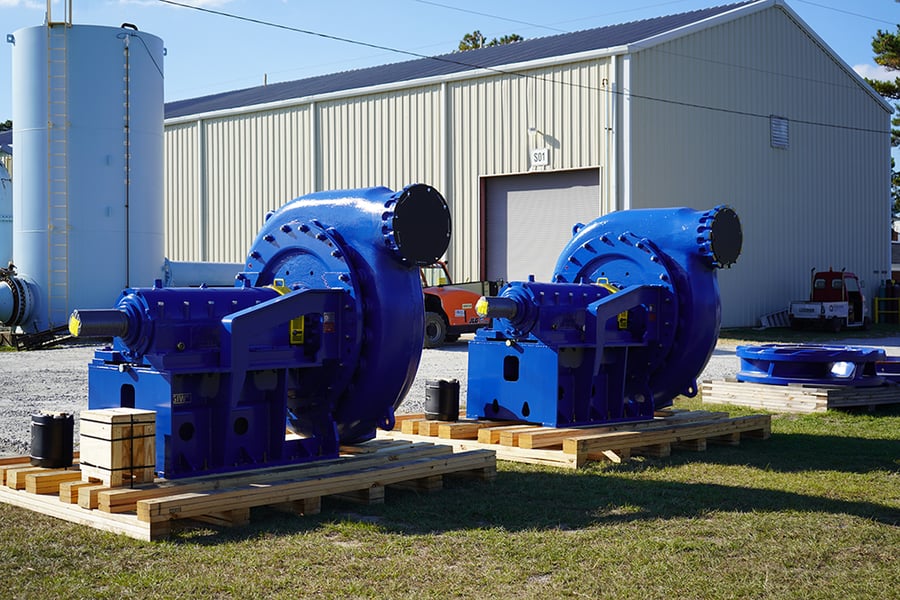
The right data is vital to optimizing slurry pump performance, which makes it essential for those who work with pumps to understand the slurry pump performance curve. Use this guide to understand the importance and application of this information — and see how the GIW® SLYSEL platform can make monitoring and optimizing pump performance easier.
What is a slurry pump performance curve?
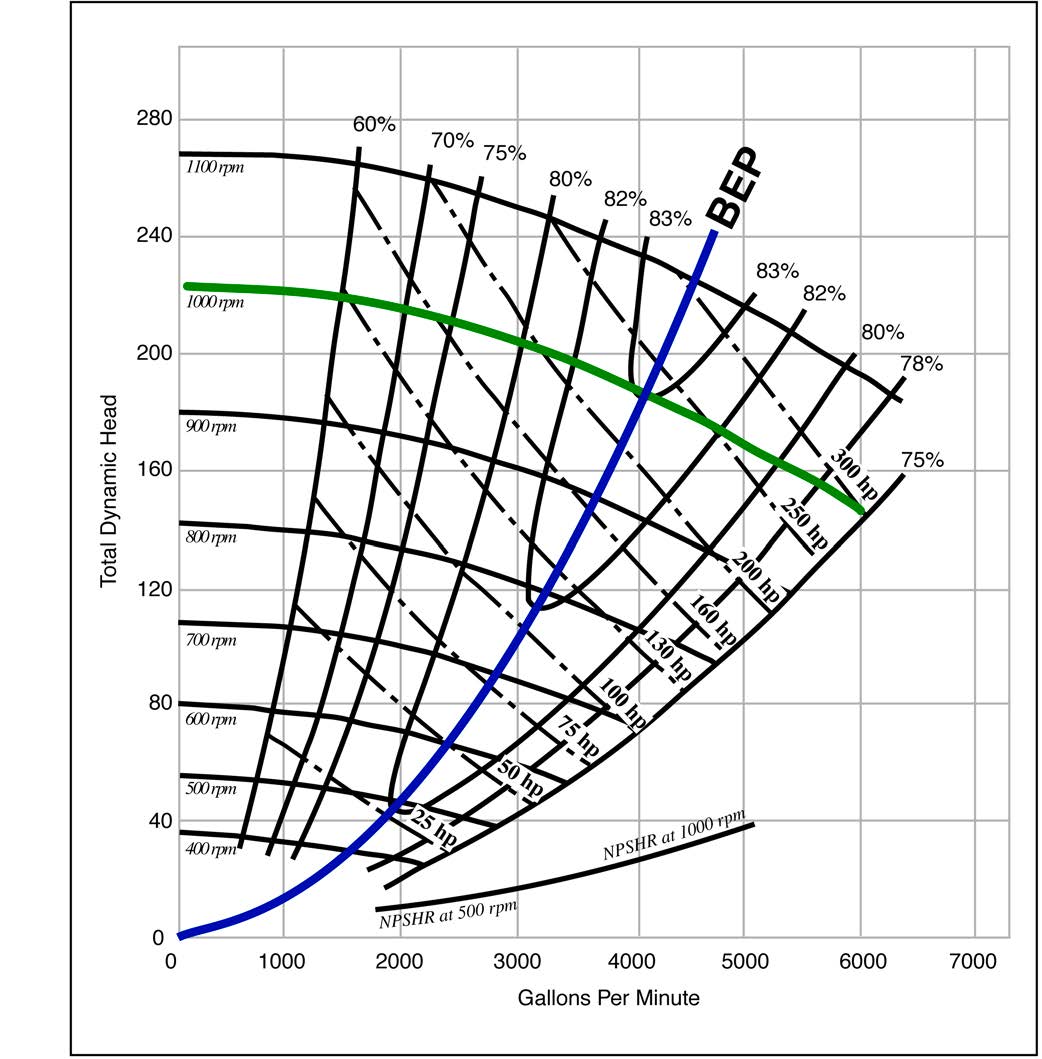
A slurry pump performance curve is a graph of the hydraulic pressure — also known as head — a pump produces for different flow rates at a certain speed. Flow rate and head have an inverse relationship: Assuming a constant speed, when the flow rate increases, the head decreases. In its most basic form, the performance curve graph can be used to determine the best efficiency point (BEP) and, thus, the best flow rate for your pump.
 |
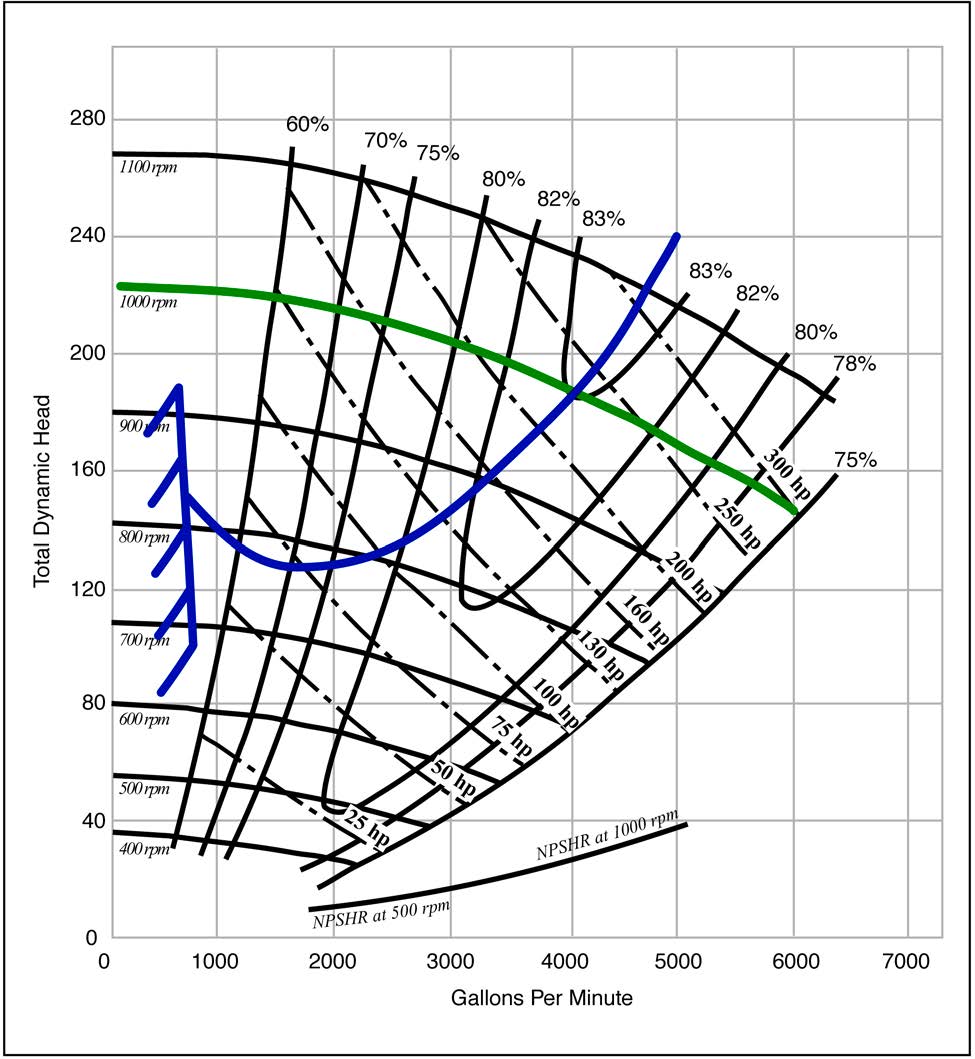 |
A full performance curve will also include the power required to achieve a certain flow rate and head, efficiency — the ratio of energy transferred to the fluid to the energy consumed by the pump — and the net positive suction head (NPSHR) needed to achieve a specific result. All this information in one graph can be intimidating, but it’s a helpful resource for optimizing the operation and performance of a slurry pump.
The power formula
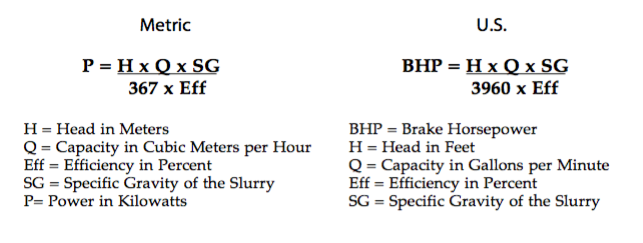
Now, it’s time for the math. The formula for calculating the power (in metric units) necessary for pump operation is P = (H*Q*SG)/(367*Eff), including the following variables:
- P = Power (kW)
- H = Head (m) is found on the y-axis of the graph
- Q = Capacity (m3/h) data on the x-axis
- SG = Specific Gravity of the slurry
- Eff = Efficiency (in decimals) is the vertical curve
To determine the power required for a certain duty condition, simply plug H, Q, SG, and Eff into the above equation.
Potential problems — and the SLYSEL solution
Unfortunately, not everything can be accounted for on the graph alone. It can, for instance, be difficult to read the curve for those without prior experience or knowledge, and slurry pumps pass solids as well as liquid, which will affect data accuracy. Without accurate information, pumps can have issues with low flow rate, line blockages, system instabilities, and low production.
That’s where SLYSEL comes in. The SLYSEL platform reads the slurry pump performance curve, calculates the power requirements, and makes pump adjustments in response to external variables.
While SLYSEL does a lot to simplify the process of reading and adjusting slurry pump performance curves, it’s still useful to get familiar with the graphs and calculations. Performance curves offer a lot of useful information for maximizing the efficiency of slurry pumps. Understanding how they work, and how to read and interpret them, is a big step toward understanding how slurry pumps operate — and how to get the most out of yours.